Update: Video recording of the meet up here:
This video is no longer available on YouTube (original link).
Come to the PyDSLA January Meetup to hear talks about PyMC3 and jobs.py!
REGISTER HERE
For this event we are incredibly fortunate to have two incredibly speakers give really interesting talks.
REGISTER HERE ON EVENTBRITE
DATE AND TIME
Wed, November 2, 2016 6:30 PM – 9:30 PM PDT Come to the PyDSLA November Meetup to hear talks from the community! In the last month, the organizers of the PyDSLA Meetup sent out a call for speakers, and the community answered with a number of great members coming forward willing and able to talk about some of the cool ways they are using the Python Data Science ecosystem to do cool stuff.
Update: This event has ended. Slides are available here. # Update: Video recording by Carl Mullins: # This video is no longer available on YouTube (original link).
SIGN UP HERE!
Video Available Now:
▶ PyDSLA The Nitty Gritty of Advanced Analytics Using Apache Spark in Python May 5, 2016 Talk by Miklos Christine, solutions engineer at Databricks
Join PyDSLA for a talk by Erin LeDell Intro to Machine Learning with H2O and Python
Get your tickets HERE
Summary:
This workshop will provide an overview of how to use H2O, the scalable open source machine learning library, from Python. The core algorithms of H2O are implemented in Java, however, fully-featured APIs are available in R, Python, Scala, and also through a web interface. The focus of this hands-on workshop will be the “h2o” Python module.
Tickets available HERE
Talk:
Jihoon Son Presents - Introduction to Apache Tajo: Future of Data Warehouse
Abstract: Apache Tajo is a data warehouse system for Web-scale data. It provides virtual integration of a multitude of diverse data sources, thereby facilitating easy and rapid data integration which has been regarded as an essential, but heavy step in business intelligence. In addition, it has a fault-tolerable distributed query engine for accelerating query speed. With the “query federation” and “distributed processing” capacities, Tajo is capable of providing users with reliable and efficient analysis of Web-scale data spread on multiple sources. I will introduce Apache Tajo including its overall architecture, current state and challenges, and discuss advantages what Tajo can bring to users. In addition, I will give a brief demo of Tajo.
If you’ve never heard of kaggle, I guess the first question I have to ask is “how did you end up on DataScience.LA?” :)
Kaggle is one of the foremost machine learning competition websites on the internet. Companies from GE to Criteo and everything in between create competitions. These competitions are in the form of a dataset, ranging from small to relatively large (up to many many gigabytes), a stated goal (such as predicting an event or finding a numeric value) and an evaluation criteria. The Kaggle community has grown in the last few years, so that now competitions often host thousands of participants!
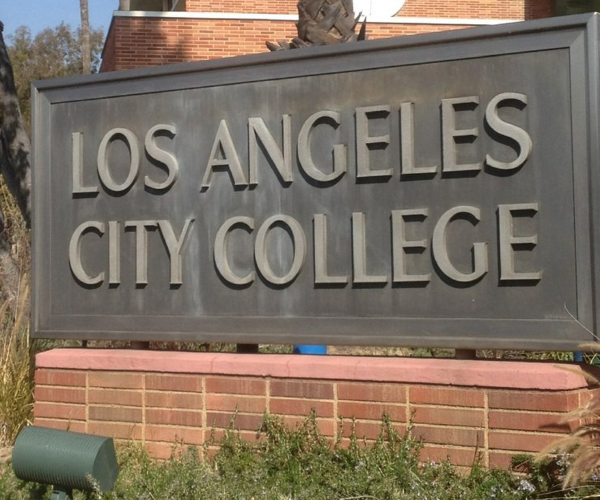
In a partnership with the City of Los Angeles government, LA City College (LACC) has formed a civic data analysis team for 2- and 4-year college students and anyone looking to enter the data science profession. The team will complete a beginning-level data analysis project on Friday afternoons during a 10-week period during the Fall 2015 semester, using data provided by the City of LA. We will present our results to City of LA staff in December.
Click HERE to sign up on Eventbrite!
This is the second event of the new Data Warehouse, Business Intelligence and Analytics meetup.
Talks:
1. Eduardo Arino de la Rubia: MySQL to Vertica with Tungsten Replicator
In this very (very) short talk, I will discuss how you can, for free, stream your MySQL data to a Vertica Community Edition cluster, and do near real-time analytics on up to 1TB of data.
On May 14th at the Venice Arts Center, the Los Angeles Python and Data Science communities were fortunate to hear a talk from world-renowned expert and CEO of Dato, Carlos Guestrin. Often times when you have a meetup where a presenter is tightly identified with a company, the concern is that the presentation will fundamentally become a product pitch. We had nothing to be worried about in this case - Carlos presented for nearly an hour on a wide range of subjects from how the Machine Learning pipeline has changed over time to Deep Learning!
*** EVENTBRITE LINK HERE ***
PyDSLA - Dato: A Platform for Practical, Large-Scale Machine Learning
Join PyDSLA for a talk by Carlos Guestrin about Presents Practical, Large-Scale Machine Learning in python.
Summary:
Data Science is perhaps the hottest profession on the market today. Folks with backgrounds ranging from Statistics and Physics to Engineering and Computer Science are eager and excited to transition to this field. However, designing and deploying data analysis and machine learning apps at scale is a significant challenge to overcome: For some folks, machine learning algorithms and methods can be obscure, too mathy, and disconnected from practice. For others, writing and deploying scalable software requires significant effort, which distracts them from focusing on their deep analytic efforts.
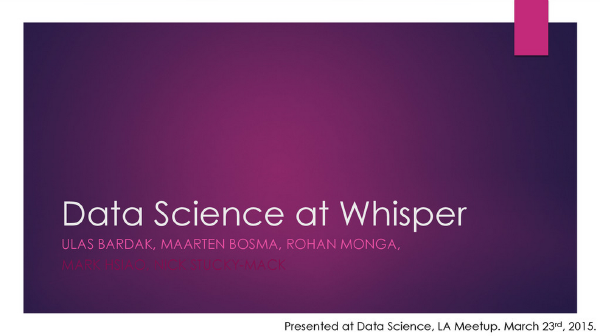
Where were you on the evening of Monday, March 23rd? Do you remember what you were up to? If you were one of the over 100 attendees to the latest installment of Szilard’s Data Science Meetup, you definitely remember! You were at Cross Campus Santa Monica, receiving a teaser on fundamentals of probabilistic programming by LA ML Meetup founder Rob Zinkov along with a detailed master class on modern machine learning architectures and approaches by Los Angeles’ own Whisper!
What is DataFest? # DataFest is a team competition, where a team of up to 5 undergraduate students has less than 48 hours to provide the best insight gleaned from a large, complex data set — and communicate that insight to an audience of their peers and the DataFest judges. DataFest 2015 will be April 24th through the 26th, beginning at 6pm on Friday the 24th.
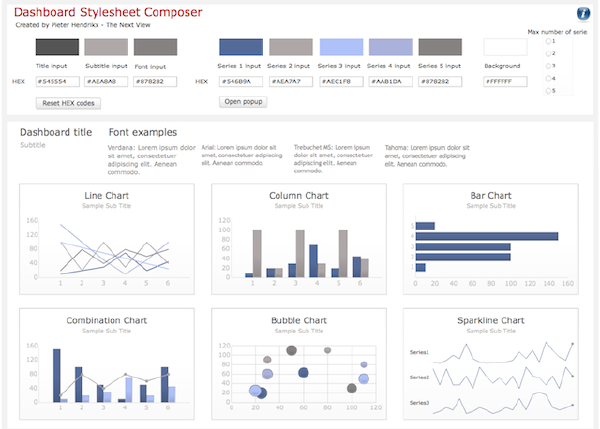
The Shiny framework, by RStudio, is growing in popularity as a tool that makes it easy for R developers to leverage the web as a deployment platform for sharing their analysis. However, since the very earliest release of Shiny, the development group has been bombarded with the same series questions over and over again, questions like “Does it work with d3.js?” and “Can I use JavaScript in Shiny?”
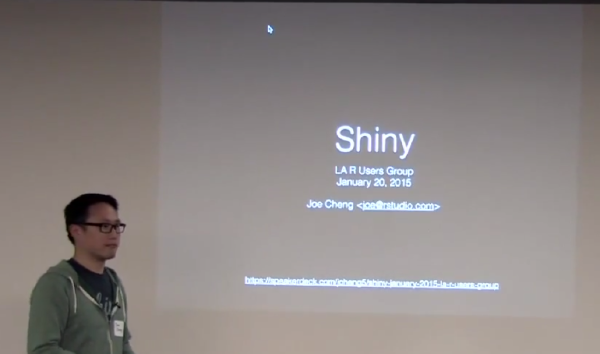
The Shiny framework is a web application framework for the R programming language, designed by Joe Cheng, to help R programmers turn their analysis into interactive web applications. Fortunately, it does without requiring that the R programmer know HTML, CSS or JavaScript - greatly widening the possible audience of users. At the January DataScience.LA R Meetup, we were fortunate to have Joe Cheng, Software Engineer at RStudio and original architect of Shiny present an introduction to Shiny.
Join PyDSLA for a talk by Matthew Rocklin about the high level APIs being developed for Python for expressive data manipulation and analysis.
Summary:
Pandas and NumPy serve us well. They give interactive high-level access to efficient low-level code. As datasets grow larger than memory this low-level code becomes obsolete but the high-level interface remains valuable. Blaze connects that high-level interface to a number of other computational systems like SQL, Mongo, or Spark, extending the scope of interactive analysis. In this talk we go over common use cases and Blaze as well as a bit of its internal design.
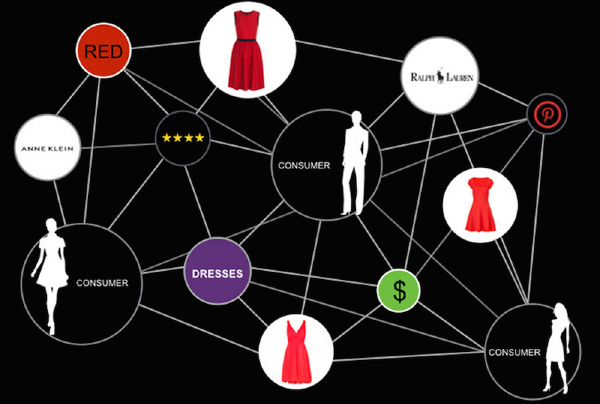
Ben Zamanzadeh - Data Science @ Datapop - LA Data Science meetup - January 2015 · Speaker Deck On January 13th, DataScience.LA held its first Data Science meetup of 2015, hosting a speaker from a local semantic advertising startup, DataPop. Their CTO, Dr. Ben Zamanzadeh, gave an in-depth presentation (linked above) of his perspective on e-commerce and advertising, which focused on extracting semantic meaning and DataPop’s marketing knowledge graph. He began his talk by discussing the evolution of e-commerce and moved quickly to semantics, making some very strong statements regarding DataPop’s architectural choices. For example, even though they provide a semantic graph, they are based on Redshift and do not use graph databases - which was quite the surprise to us here at DataScience.LA! At one point, Dr. Zamanzadeh even commented,
We are pleased to announce the first meetup of the LA Data Warehouse, Business Intelligence and Analytics meetup group! On February 9th, we have 4 speakers scheduled to give an engaging overview along with a few of their insights into the field.
It pains me to admit it, but even though I had visited their site, created an account, and played around with their tools, I didn’t really get the value proposition behind Plot.ly. I already use ggplot, bokeh, and d3.js, I already use knitr and ipython notebooks, so why do I need a new way of posting my plots on a web page?
Plotly is a web-based platform for making graphs and analyzing data. Plotly’s APIs and web app let teams work together online to make 2D, 3D, and streaming graphs using R, Python, MATLAB, Julia, SAS, and and Excel, all together, all in one platform. The goal is to support technical and non-technical collaboration at all levels. Plotly translates ggplot2, matplotlib, and MATLAB plots into interactive, web-based, shareable plots.