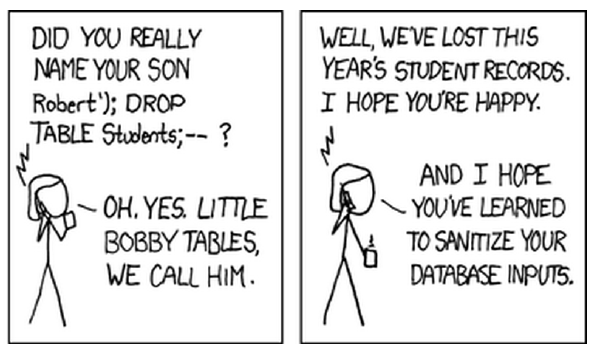
Shiny takes inputs from UI elements and sends them to the server, where the application can access them as R variables. While Shiny has security measures in place, as in any typical web application, it remains the developer’s responsibility to sanitize the inputs before using them. For example, Shiny has no way to protect you if you are using an input in a SQL query such as select ... from ... where field = 'input'. Someone manipulating the websocket communication can craft a specially-formatted input that can force the database to execute a query that it is not supposed to do, termed an SQL injection. This might give an attacker access to private data or the ability to do other nefarious things, and it is a common security issue.
(Posting the slides and video recording from this event is long overdue - our apologies for the delay.)
At the September LA Data Science/Machine Learning meetup we had IRIS.TV’s Chief Data Scientist Tom Sullivan and VP of Engineering Joel Spitalnik presenting.
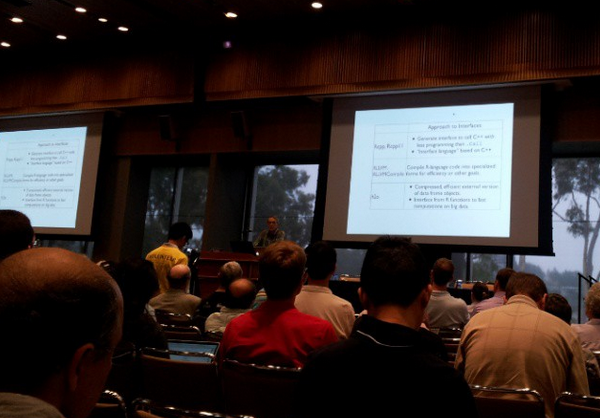
IRIS.TV is a video recommendation engine, and in their excellent talk Tom & Joel shared with us their approach to personalization and how they use machine learning to achieve their goals. They also shared the architecture of their systems, including how data is flowing between the various parts (i.e. the ETL pipeline). One thing that popped up as a question and I found interesting is that the usage of R and Python in their company is split 50-50. In fact, while Tom is using mainly R, Joel is using mainly Python. While this is perhaps unusual at a relatively small startup, our survey on software tools used for data science revealed that most data scientists in LA (at least those attending the meetups) are using R or Python, with a roughly equal split/small advantage for R. It just happens that for obvious reasons (such as network effects) that one tool dominates in most companies.
Yesterday, I published a post here on DataScience.LA with a simple/basic benchmark for dplyr. It was the main part of a short talk at our last Los Angeles R meetup. Below, I continue my thoughts with some reflections on dplyr’s API and philosophy, AKA the other part of my talk.
Earlier this month I gave a short talk about dplyr at the Los Angeles R meetup. It was one of the 5 talks about the useR! 2014 conference, and you can see the summaries and slides from the other 4 talks here.
Data Science @ Datapop: The Marketing Knowledge Graph
presented by Dr. Ben Zamanzadeh, CTO at DataPop
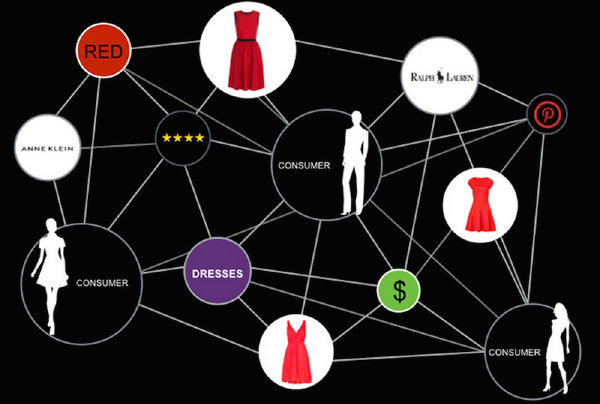
Today’s eCommerce has evolved into a complex multi-dimensional optimization problem. DataPop’s semantic technology and Marketing Knowledge Graph is used to generate Omni-Channel advertising campaigns. This presentation will review our technology stack, machine learning models, discuss what worked what did not work for us and do a live demo of Marketing Knowledge Graph.
At this meetup we’re fortunate to have RStudio’s lead developer Joe Cheng flying in from Seattle to talk about Shiny. Shiny makes it possible to develop interactive web applications by writing only a handful of R code. It lowers the barriers to constructing interactive dashboards that you can use to better explain your results to your boss and/or co-workers, or it can help you productionalize your analysis so that others in your company can make use of it regularly without the need to continually bother you.
Last week the LA R meetup featured another round of 5 speakers each highlighting a few things they had found interesting at the useR! 2014 conference. This was the second such event after the first one in September - probably because useR! was awesome enough that it inspired 10 volunteers to stand up on stage and talk more about it.
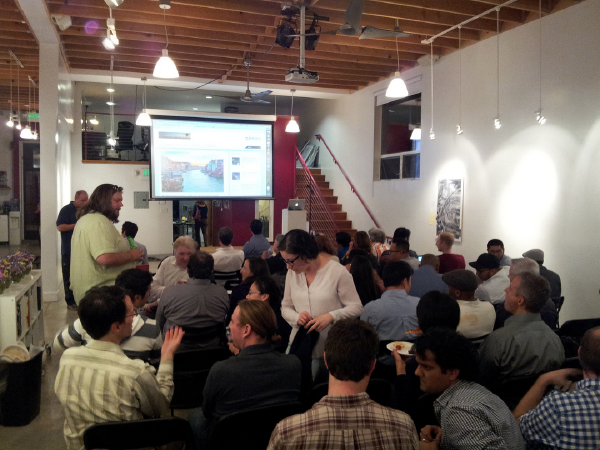
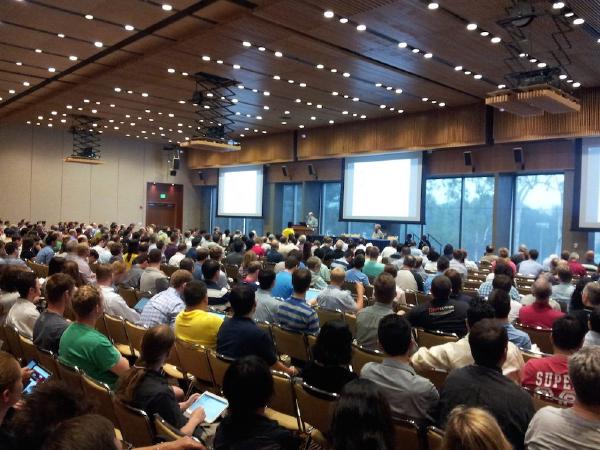
Last week, the Python Data Science LA meetup debuted with a fabulous event. It was already much anticipated, with more than 250 people showing interest (RSVP+waiting list), and a lucky 100 converged upon the hip Venice Arts venue to hear our speakers. Our sponsor OpenMail has also done a fantastic job in getting us this venue, bringing food+drinks and taking care of all the details. Thanks OpenMail Team!
At this meetup, five more LA R meetup members will present short talks of what they have learned at useR! 2014. This is the 2nd round of talks about useR! since we had twice as many volunteers to speak as we could accommodate in one meetup (indeed, useR! was that awesome). The first round of talks at our September meetup is summarized here (with slides).
I ♥ data. But I also ♥ privacy. Even though I have been running a few data meetups for the past few years, I have managed to keep myself out of public eye - even in my professional life. I must admit, I’m giving a bit away in an recent interview with Data Science Weekly. They had excellent questions to pose, and I’d like to take a moment here to summarize two main points from the interview: my thoughts on when and how much time it took me to became a data scientist and how I feel about the hype in the field today. If you’d like, you can read the full interview here.
I’m pleased to announce the first event of our new Python Data Science LA meetup, started by two of us here at DataScience.LA (our very own Szilard and Eduardo).
We’ll have 5 speakers at this event, covering various aspects of the Python Data Science ecosystem (NumPy, SciPy, pandas, matplotlib, scikit-learn, NetworkX, NLTK, IPython notebook, etc.)
This is a re-publication of a blog post from a blog I created not long before we got the idea to start DataScience.LA, and in many aspects it is the genesis of DSLA (the blog’s name, the people getting together - thanks Eduardo, Amelia and Leigh). It was also the spark that lead to the creation of the Python Data Science LA meetup.
Last week the LA R meetup featured 5 speakers each highlighting a few things they had found interesting at the useR! 2014 conference (which I had the pleasure of helping to organize this year in Los Angeles). This meetup proved to be interesting even to those of us who attended the conference (which was about half of our audience), simply because there were so many cool things to hear and enough parallel sessions at the conference that no one could possibly capture all of the action.
Today I am happy to announce that we are expanding our partnership on several fronts with my friend Subash D’Souza, a leader of the Big Data community in LA.
During the past few years I have been organizing several data science meetups in Los Angeles (LA R, DataVis LA, Data Science/Machine Learning) and Subash has provided the same kind of leadership on the big data front (LA Hadoop, HBase, LA Big Data). While I think of big data as primarily technology and of data science as a blend of statistics and technology (and not only for large data sets), there is clearly a significant overlap between these two fields. Considering this overlap, we have already been collaborating for some time regarding these various meetups, e.g. organizing joint events or speaking at one another’s meetups.
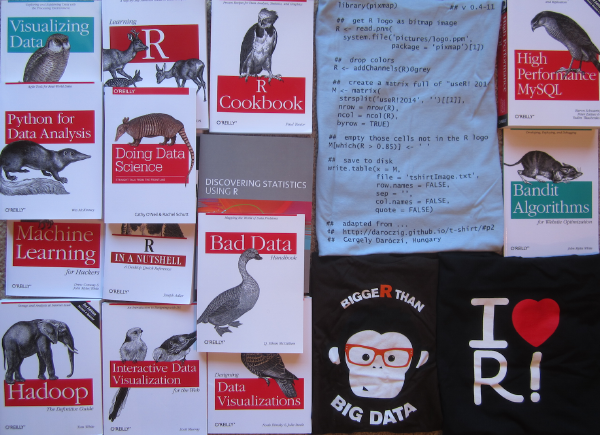
We have a few pieces of swag that we are raffling off to the community at our upcoming meetup events. Our stash consists of 25 data-oriented books, primarily from O’Reilly plus 25 T-shirts from useR! 2014 conference and Revolution Analytics (see picture above). Did we get your attention?
I am excited to announce that we are starting a new meetup group - Python Data Science LA - to serve the needs of the LA data science community using Python!
At an earlier Data Science/Machine Learning meetup we conducted an informal survey on tools for Data Science which showed that a large majority of data scientists use R or Python, with R taking a slight lead. (I know, those attending the meetups bias the results towards open source tools.)
Data Science @ IRIS.TV
by Dr. Thomas Sullivan, Chief Data Scientist and Joel Spitalnik, VP Engineering
While video recommendations best serve the viewer experience when presented in real time, machine learning is a computationally intensive process that is often done on the back end. IRIS.TV’s utilizes a hybrid process to synchronize computational tasks for learning so that engineering and data science teams can shrink the latency between analyzing history and presentation of recommended videos to improve the experience.
Five LA R meetup members will present short talks of what they learned at useR! 2014
(plus we have 5 more volunteers for the following meetup!)
1. Timothy J. Triche, Jr., PhD
Fellow, Jane Anne Nohl Division of Hematology, USC/Norris Comprehensive Cancer Center
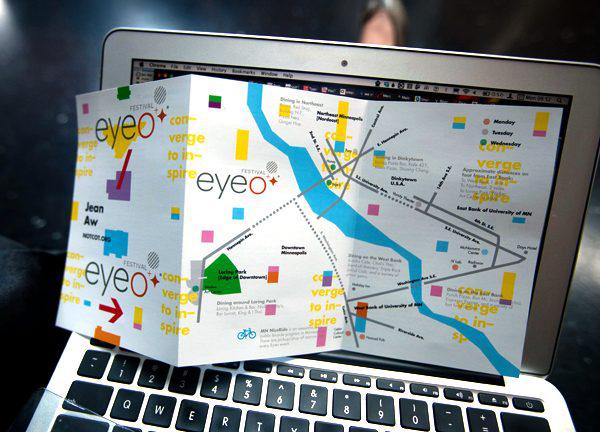
Eyeo festival highlights
Amelia McNamara
From the festival website, “Eyeo assembles an incredible set of creative coders, data designers and artists, and attendees – expect enthralling talks, unique workshops and interactions with open source instigators and super fascinating practitioners.” I’ll talk about some of the most inspiring talks and projects I saw at Eyeo this year, including work by Santiago Ortiz, Lillian Schwartz, Cod.Act, Kate Crawford and Nicholas Felton. Most of this work can be described best by the term “art,” so come expecting provocations, not prototypes. To learn more about the festival, visit eyeofestival.com
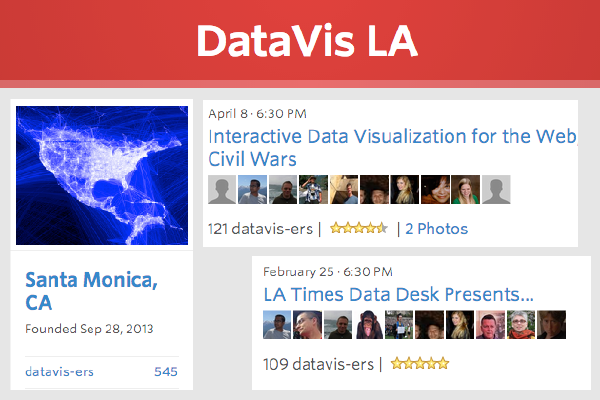
Data visualization helps us understand data. The DataVis LA meetup discusses the many aspects of data visualization: exploratory data analysis, presentation graphics, infographics, design, art, etc., and brings together a diverse community of data scientists, statisticians, software developers, BI specialists, business analysts, journalists, designers and artists with the goal of learning more about the art and science of data visualization from each other.