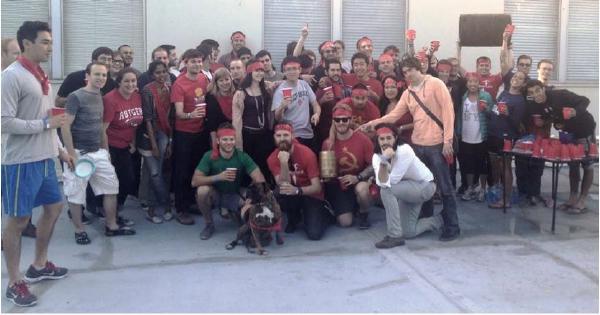
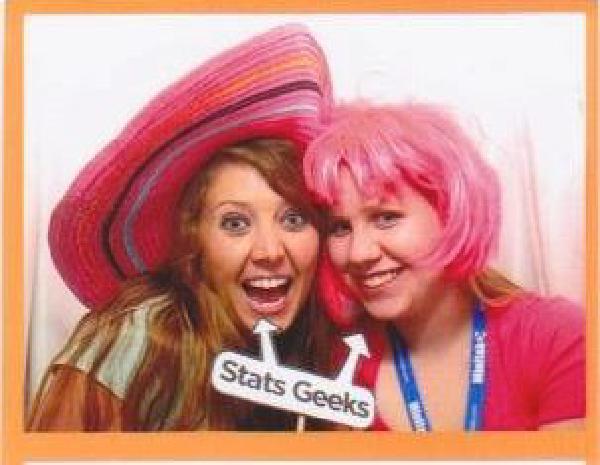
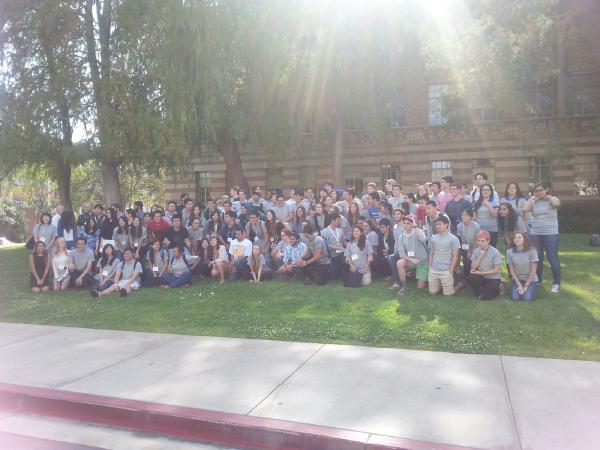
Come and have fun with local useRs at SatRday LA on April 6, 2019. This is the first SatRday in LA, and the second in the states. If you have not heard of SatRday, it is a one-day affordable, inclusive, non-profit R conference organized by local R users.
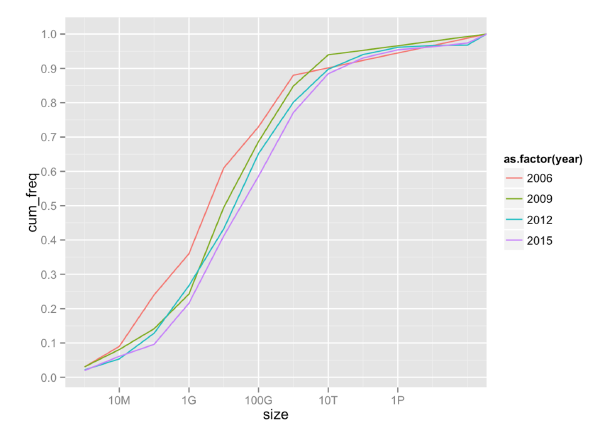
With so much hype about “big data” and the industry pushing for “big data” analytical tools for everyone, the question arises how many people have big data (for analytics) and how many of them really need these tools (which are more complex and often more immature compared to the traditional tools for analytics).
One of the best things I like in working at CARD.com is that I am not only crunching R code in 24/7, but I also have the chance to interact with and improve the related data infrastructure with some interesting technologies.
After joining the company in January, I soon realized that while Impala is a very powerful database for handling data that do not comfortably fit in MySQL, it’s still not as fast as one might expect when querying large amount of data from R. Sometimes I had to wait several minutes for a query to run! So I used this spare time to think about how to improve the workflow.
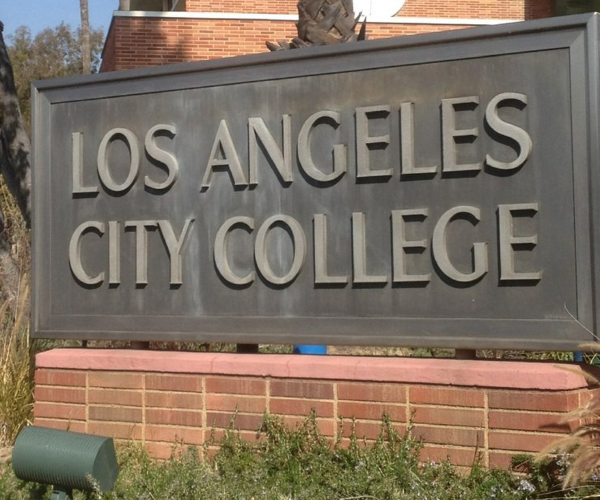
In a partnership with the City of Los Angeles government, LA City College (LACC) has formed a civic data analysis team for 2- and 4-year college students and anyone looking to enter the data science profession. The team will complete a beginning-level data analysis project on Friday afternoons during a 10-week period during the Fall 2015 semester, using data provided by the City of LA. We will present our results to City of LA staff in December.
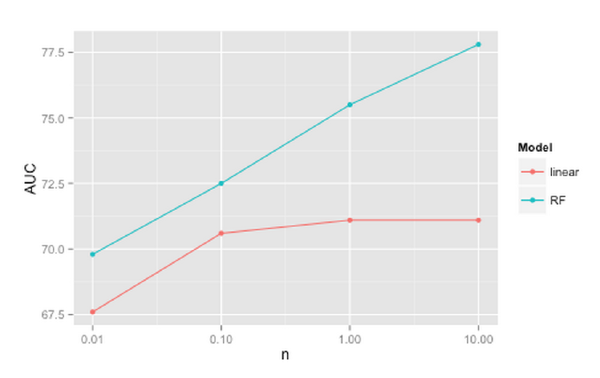
I currently have the need for machine learning tools that can deal with observations of the order of 10 millions in the context of binary classification. That kind of data is a few GBs in size and it fits comfortably nowadays in the RAM of a decent single machine. It is a trivial task for linear models, as there are plenty of open source tools that can train a logistic regression with this amount of data on a single machine in a few seconds, even while using only 1 processor core (many of these tools are single-threaded). Linear models are also the gold standard of large-scale machine learning that can run on clusters, processing very large distributed datasets.
What is DataFest? # DataFest is a team competition, where a team of up to 5 undergraduate students has less than 48 hours to provide the best insight gleaned from a large, complex data set — and communicate that insight to an audience of their peers and the DataFest judges. DataFest 2015 will be April 24th through the 26th, beginning at 6pm on Friday the 24th.
Part 2 of the dplyr tutorial is now available! Hadley will be covering Grouped Mutate/Filter, Joins, Do, and Databases. (You can find Part 1 of the tutorial here.)
For our viewers who have just discovered the wonders of R, keep in mind that this tutorial was filmed in early July of 2014. As R packages naturally update over time (well, depending on the programmers!), please make sure to check Hadley’s Githubfor the latest changes to the dplyr package.
David Diez works on the OpenIntro team, which develops open-source textbooks, statistical software labs, and other course resources for intro-level statistics. This video above is the talk he gave at useR! 2014 entitled “Textbooks fail where Software Succeeds” in which he outlines the challenges unique to open-source textbooks, the state of OpenIntro, and how people can get involved. Below, he discusses these challenges further and offers his thoughts around their solutions.
Hadley Wickham (perhaps you’ve heard of his work) presented a 2 hour workshop on dplyr at this year’s useR! conference at UCLA. This tutorial was definitely a highlight of the week-long conference for me, and working on this tutorial video has also made me very appreciative of how versatile the dplyr package can be. It clearly is the chef’s knife of data science tools.
(This is my third post on statistics graduate school. You can read the first, on coursework, the difference between a Masters and a PhD, and proving your worth here, and the second, on advancing to candidacy, writing the dissertation, and having fun in grad school, here.)
As someone who has spent a significant amount of time ‘data wrangling’ outside the field of data science, I found this recent New York Times article both highly interesting and nothing new - I’ve seen the same issue discussed in a variety of fields with similar automation solutions presented each time. Granted, there are fields where this janitorial drudgery is absolutely necessary, such as molecular biology. As a scientist working on researching mRNA expression you certainly have to keep RNase-free conditions, meaning you have to ‘clean up’ your bench in a more detailed way than you’d ever imagine before you can run your first PCR cycle. This includes specific protocols for washing your dishes several times with special water before you even start because if you don’t, you’re not likely to get any bands in your electrophoresis gel and you’ll lose several days (or weeks!) of work.
(Note: This is my second installment on grad school, you can read the first part on coursework, the difference between a Master’s and a Ph.D., and proving your worth, here.)
Advancement to candidacy # After finishing coursework, the next step in our PhD program is to “advance to candidacy.” This is the formal process of proposing your dissertation research. Our department has a diverse set of research interests, both theoretical and applied, so dissertations can take a variety of forms. This is yet another difference between Master’s and PhD projects– typically, Master’s projects are more directed by faculty members and PhD projects are chosen primarily by the students themselves. Either way, the process begins with a conversation between the student and his/her advisor.
Another exciting development in data science coming from our department at UCLA is a high school class called Introduction to Data Science (IDS). This project has been made possible by a National Science Foundation grant to support Mobilize, for which Rob Gould (mentioned in my previous post on DataFest) is the Principal Investigator.
By now I’m sure you’ve checked out our blog and have wondered, ‘How can I contribute my ideas and share my projects with the community?’ There are two ways to contribute content to DataScience.LA, either as a regular contributor or through our Blogging Accelerator. Our vision is to help unleash you, members of the community, as effective data science communicators while establishing Los Angeles as one of the leading places for data thinking, data journalism, and data science. (Ready to write a blog post right now? Send us an email at info@datascience.la to get started as a contributor.)
As a PhD graduate student in statistics here at UCLA, I’d like to talk a bit about our graduate program to give you an idea of what to expect if you’re interested in UCLA or statistics graduate school in general. First, it’s important to note that UCLA does not have a specific “data science” degree program at this point; the department offers a PhD and a Master’s degree, both simply labeled “statistics.” Some statistics departments have made the decision to change their name to “data science,” but that is often just a marketing decision. The UCLA department is pretty forward-thinking and has a focus on computation, so it’s fairly “data science”-y without having that exact name.
Below is the first of several exciting data science developments for the younger generation, happening right here in Los Angeles. This project is unique because it engages undergraduates in real data analysis, something that happens quite rarely in a classroom. If projects like this catch on as a new trend, we’re going to have some real competition for our jobs in a few years!