If you’ve never heard of kaggle, I guess the first question I have to ask is “how did you end up on DataScience.LA?” :)
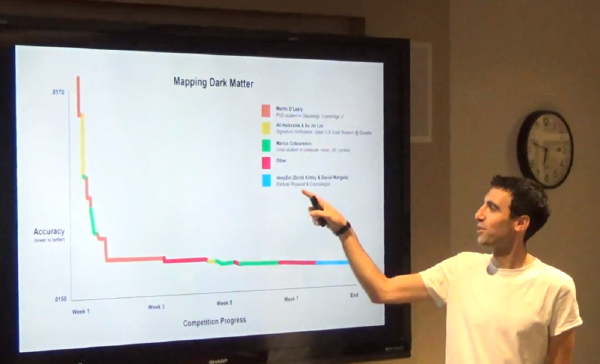
Kaggle is one of the foremost machine learning competition websites on the internet. Companies from GE to Criteo and everything in between create competitions. These competitions are in the form of a dataset, ranging from small to relatively large (up to many many gigabytes), a stated goal (such as predicting an event or finding a numeric value) and an evaluation criteria. The Kaggle community has grown in the last few years, so that now competitions often host thousands of participants!
Our next Data Science meetup:
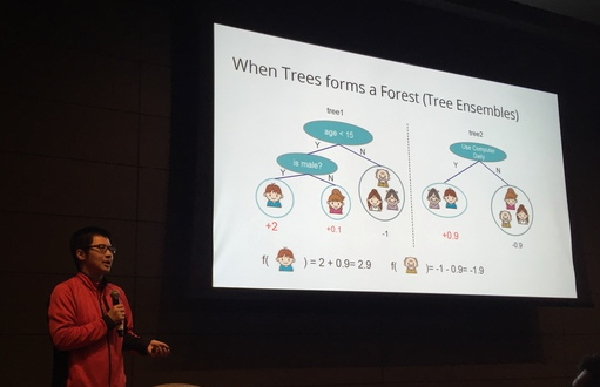
Winning Data Science Competitions
by Jeong-Yoon Lee
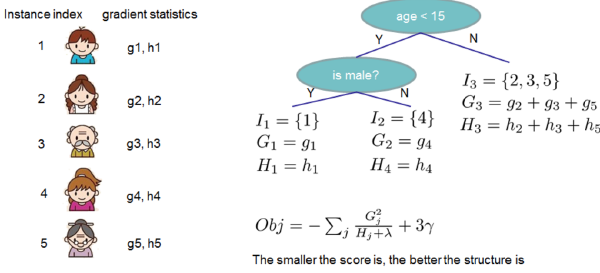
In this talk, I am going to share my experiences in data science competitions. After an overview of the competition structure and best practices, I will present the 1st prize winner’s solution for KDD Cup 2015 with the behind-the-scenes story.
Where were you on the evening of Monday, March 23rd? Do you remember what you were up to? If you were one of the over 100 attendees to the latest installment of Szilard’s Data Science Meetup, you definitely remember! You were at Cross Campus Santa Monica, receiving a teaser on fundamentals of probabilistic programming by LA ML Meetup founder Rob Zinkov along with a detailed master class on modern machine learning architectures and approaches by Los Angeles’ own Whisper!
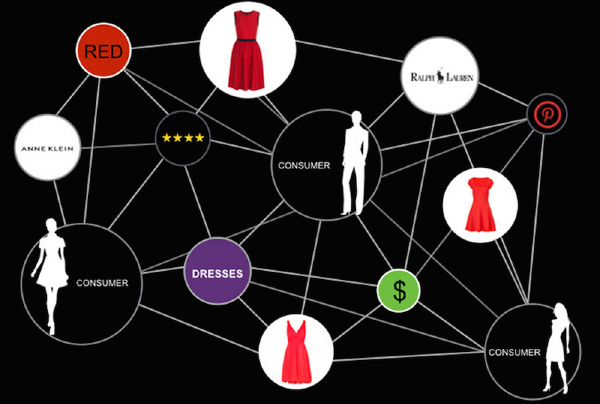
Ben Zamanzadeh - Data Science @ Datapop - LA Data Science meetup - January 2015 · Speaker Deck On January 13th, DataScience.LA held its first Data Science meetup of 2015, hosting a speaker from a local semantic advertising startup, DataPop. Their CTO, Dr. Ben Zamanzadeh, gave an in-depth presentation (linked above) of his perspective on e-commerce and advertising, which focused on extracting semantic meaning and DataPop’s marketing knowledge graph. He began his talk by discussing the evolution of e-commerce and moved quickly to semantics, making some very strong statements regarding DataPop’s architectural choices. For example, even though they provide a semantic graph, they are based on Redshift and do not use graph databases - which was quite the surprise to us here at DataScience.LA! At one point, Dr. Zamanzadeh even commented,
(Posting the slides and video recording from this event is long overdue - our apologies for the delay.)
At the September LA Data Science/Machine Learning meetup we had IRIS.TV’s Chief Data Scientist Tom Sullivan and VP of Engineering Joel Spitalnik presenting.
IRIS.TV is a video recommendation engine, and in their excellent talk Tom & Joel shared with us their approach to personalization and how they use machine learning to achieve their goals. They also shared the architecture of their systems, including how data is flowing between the various parts (i.e. the ETL pipeline). One thing that popped up as a question and I found interesting is that the usage of R and Python in their company is split 50-50. In fact, while Tom is using mainly R, Joel is using mainly Python. While this is perhaps unusual at a relatively small startup, our survey on software tools used for data science revealed that most data scientists in LA (at least those attending the meetups) are using R or Python, with a roughly equal split/small advantage for R. It just happens that for obvious reasons (such as network effects) that one tool dominates in most companies.