*** EVENTBRITE LINK HERE ***
PyDSLA - Dato: A Platform for Practical, Large-Scale Machine Learning
Join PyDSLA for a talk by Carlos Guestrin about Presents Practical, Large-Scale Machine Learning in python.
Summary:
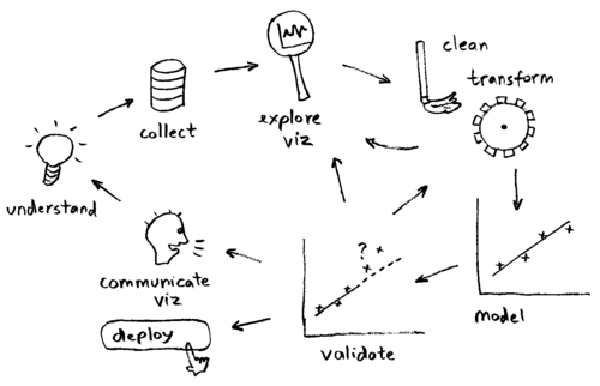
Data Science is perhaps the hottest profession on the market today. Folks with backgrounds ranging from Statistics and Physics to Engineering and Computer Science are eager and excited to transition to this field. However, designing and deploying data analysis and machine learning apps at scale is a significant challenge to overcome: For some folks, machine learning algorithms and methods can be obscure, too mathy, and disconnected from practice. For others, writing and deploying scalable software requires significant effort, which distracts them from focusing on their deep analytic efforts.
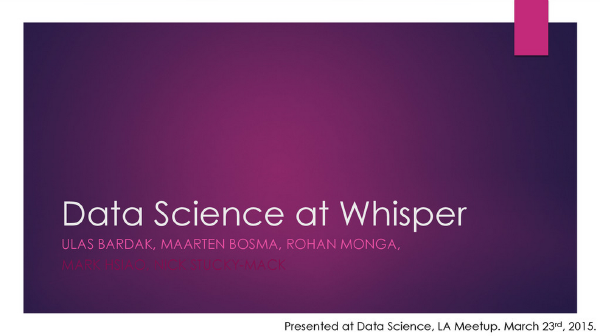
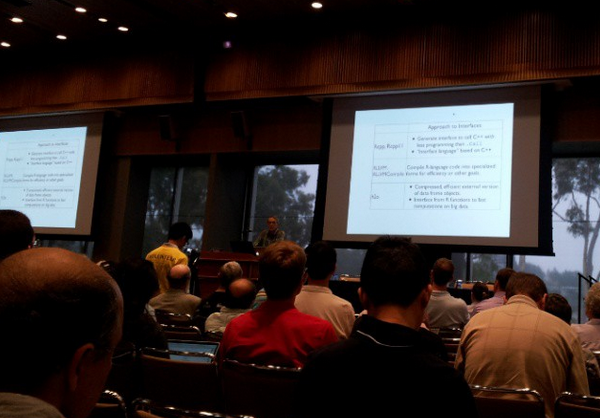
Where were you on the evening of Monday, March 23rd? Do you remember what you were up to? If you were one of the over 100 attendees to the latest installment of Szilard’s Data Science Meetup, you definitely remember! You were at Cross Campus Santa Monica, receiving a teaser on fundamentals of probabilistic programming by LA ML Meetup founder Rob Zinkov along with a detailed master class on modern machine learning architectures and approaches by Los Angeles’ own Whisper!
This meetup will be hosted by Google and we’ll have Peter Lipman and Pete Meyer talk about the data science/statistics projects they have been working on at Google.
Human Evaluation Comparisons: Common Framework with Applications
We designed a study to determine whether being on device influenced a quality evaluator’s perception of ads quality. Here, we present a common framework, developed into an internal R package, that was used to analyze the study.
The Shiny framework, by RStudio, is growing in popularity as a tool that makes it easy for R developers to leverage the web as a deployment platform for sharing their analysis. However, since the very earliest release of Shiny, the development group has been bombarded with the same series questions over and over again, questions like “Does it work with d3.js?” and “Can I use JavaScript in Shiny?”
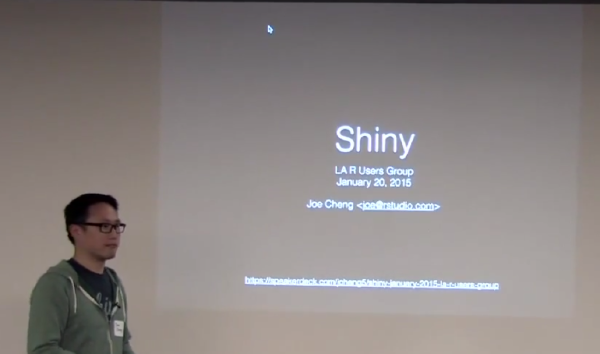
The Shiny framework is a web application framework for the R programming language, designed by Joe Cheng, to help R programmers turn their analysis into interactive web applications. Fortunately, it does without requiring that the R programmer know HTML, CSS or JavaScript - greatly widening the possible audience of users. At the January DataScience.LA R Meetup, we were fortunate to have Joe Cheng, Software Engineer at RStudio and original architect of Shiny present an introduction to Shiny.
Join PyDSLA for a talk by Matthew Rocklin about the high level APIs being developed for Python for expressive data manipulation and analysis.
Summary:
Pandas and NumPy serve us well. They give interactive high-level access to efficient low-level code. As datasets grow larger than memory this low-level code becomes obsolete but the high-level interface remains valuable. Blaze connects that high-level interface to a number of other computational systems like SQL, Mongo, or Spark, extending the scope of interactive analysis. In this talk we go over common use cases and Blaze as well as a bit of its internal design.
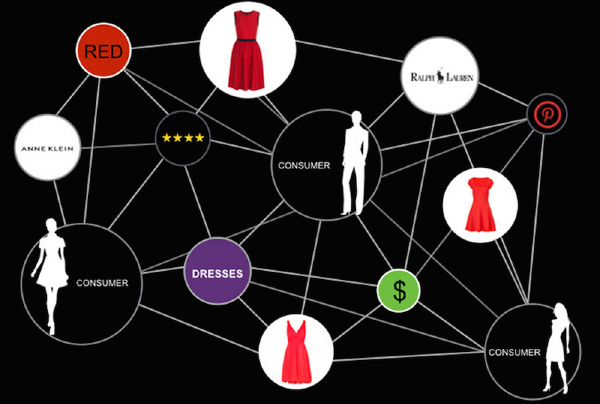
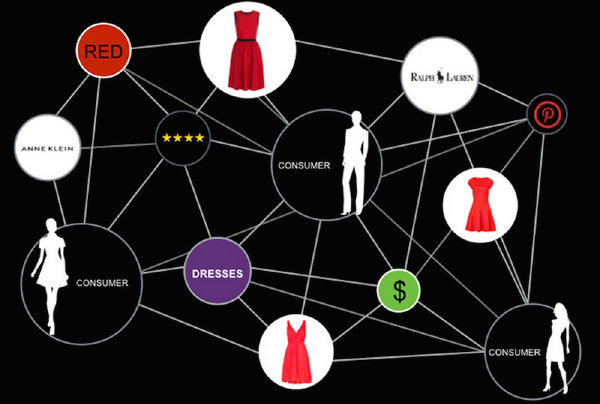
Ben Zamanzadeh - Data Science @ Datapop - LA Data Science meetup - January 2015 · Speaker Deck On January 13th, DataScience.LA held its first Data Science meetup of 2015, hosting a speaker from a local semantic advertising startup, DataPop. Their CTO, Dr. Ben Zamanzadeh, gave an in-depth presentation (linked above) of his perspective on e-commerce and advertising, which focused on extracting semantic meaning and DataPop’s marketing knowledge graph. He began his talk by discussing the evolution of e-commerce and moved quickly to semantics, making some very strong statements regarding DataPop’s architectural choices. For example, even though they provide a semantic graph, they are based on Redshift and do not use graph databases - which was quite the surprise to us here at DataScience.LA! At one point, Dr. Zamanzadeh even commented,
(Posting the slides and video recording from this event is long overdue - our apologies for the delay.)
At the September LA Data Science/Machine Learning meetup we had IRIS.TV’s Chief Data Scientist Tom Sullivan and VP of Engineering Joel Spitalnik presenting.
IRIS.TV is a video recommendation engine, and in their excellent talk Tom & Joel shared with us their approach to personalization and how they use machine learning to achieve their goals. They also shared the architecture of their systems, including how data is flowing between the various parts (i.e. the ETL pipeline). One thing that popped up as a question and I found interesting is that the usage of R and Python in their company is split 50-50. In fact, while Tom is using mainly R, Joel is using mainly Python. While this is perhaps unusual at a relatively small startup, our survey on software tools used for data science revealed that most data scientists in LA (at least those attending the meetups) are using R or Python, with a roughly equal split/small advantage for R. It just happens that for obvious reasons (such as network effects) that one tool dominates in most companies.
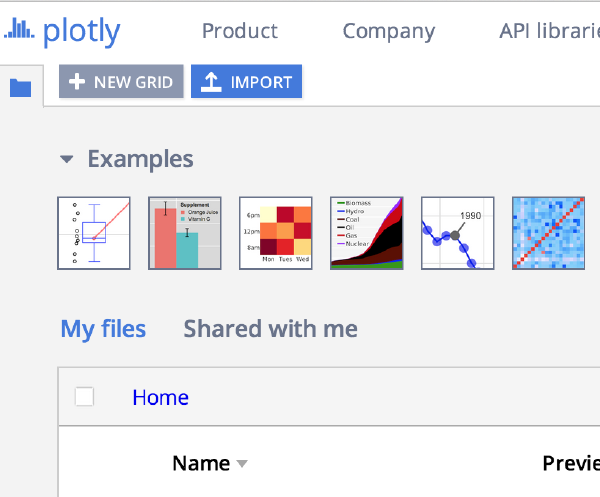
It pains me to admit it, but even though I had visited their site, created an account, and played around with their tools, I didn’t really get the value proposition behind Plot.ly. I already use ggplot, bokeh, and d3.js, I already use knitr and ipython notebooks, so why do I need a new way of posting my plots on a web page?
Plotly is a web-based platform for making graphs and analyzing data. Plotly’s APIs and web app let teams work together online to make 2D, 3D, and streaming graphs using R, Python, MATLAB, Julia, SAS, and and Excel, all together, all in one platform. The goal is to support technical and non-technical collaboration at all levels. Plotly translates ggplot2, matplotlib, and MATLAB plots into interactive, web-based, shareable plots.
Data Science @ Datapop: The Marketing Knowledge Graph
presented by Dr. Ben Zamanzadeh, CTO at DataPop
Today’s eCommerce has evolved into a complex multi-dimensional optimization problem. DataPop’s semantic technology and Marketing Knowledge Graph is used to generate Omni-Channel advertising campaigns. This presentation will review our technology stack, machine learning models, discuss what worked what did not work for us and do a live demo of Marketing Knowledge Graph.
Last week the LA R meetup featured another round of 5 speakers each highlighting a few things they had found interesting at the useR! 2014 conference. This was the second such event after the first one in September - probably because useR! was awesome enough that it inspired 10 volunteers to stand up on stage and talk more about it.
This is a re-publication of a blog post from a blog I created not long before we got the idea to start DataScience.LA, and in many aspects it is the genesis of DSLA (the blog’s name, the people getting together - thanks Eduardo, Amelia and Leigh). It was also the spark that lead to the creation of the Python Data Science LA meetup.
I have been following Big Data, Hadoop in particular, for the past four years and a lot has changed since then. At the time I was looking for the next big wave of technologies, especially on the back end of development as that was my forte at the time. After our initial introduction, the more I learned the more I felt Hadoop was the right tool to get the job done. Focusing upon the development aspects of job vs actual maintenance of the servers/cluster has always been a no-brainer for me. Now that Hadoop has been adopted by a wide variety of industries and has grown quite popular, it has become much more apparent that there are indeed areas where Hadoop is lacking. Security and real-time analytics are two of these concerns which both affect real-time processing and reporting, but fortunately there is a lot of current work happening to address these limitations. Consequently, there is a group of big data vendors who are investing a large number of resources as a remedy, bringing us newer tools such as Yarn, Tez, Storm, etc. Also, acquisitions of XA Secure by Hortonworks and Gazzang by Cloudera are contributing to the solving these issues around security.
Today I am happy to announce that we are expanding our partnership on several fronts with my friend Subash D’Souza, a leader of the Big Data community in LA.
During the past few years I have been organizing several data science meetups in Los Angeles (LA R, DataVis LA, Data Science/Machine Learning) and Subash has provided the same kind of leadership on the big data front (LA Hadoop, HBase, LA Big Data). While I think of big data as primarily technology and of data science as a blend of statistics and technology (and not only for large data sets), there is clearly a significant overlap between these two fields. Considering this overlap, we have already been collaborating for some time regarding these various meetups, e.g. organizing joint events or speaking at one another’s meetups.
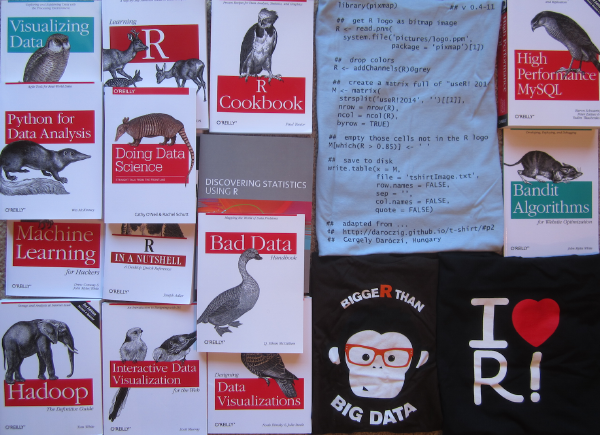
We have a few pieces of swag that we are raffling off to the community at our upcoming meetup events. Our stash consists of 25 data-oriented books, primarily from O’Reilly plus 25 T-shirts from useR! 2014 conference and Revolution Analytics (see picture above). Did we get your attention?
(Please click here if the video above doesn’t load.)
The video above is from an event at useR! 2014 consisting of Yasmin Lucero’s presentation plus an incredible panel discussion, which is included here. The title of the panel was “R’s Place in the Production Environment”, and was moderated by Tareef Kawaf, President at RStudio. Five high-profile members of the R community were on this panel, spanning the gamut of the enterprise:
(Please click here if the video above doesn’t load.)
During useR! 2014, the LA R Meetup (run by Szilard Pafka) organized an event focused on R’s status in industry. This event took the form of a presentation by Yasmin Lucero, Senior Statistician at AOL-Gravity, followed by a panel discussion. The video above captures the presentation, where Yasmin provides an excellent overview of the current status of R in the enterprise and breaks down the taxonomy of solutions for which R is commonly chosen as a development platform. From batch reporting and dashboards for internal deployment to full blown public facing analytics data products, R has certainly found a home in business. Yasmin’s talk concludes with specific, operational aspects of managing R in the enterprise, such as library and dependency management. Enjoy the video and don’t forget to tune in for Part 2 of this session where the panel discussed “R’s Place in the Production Environment.”