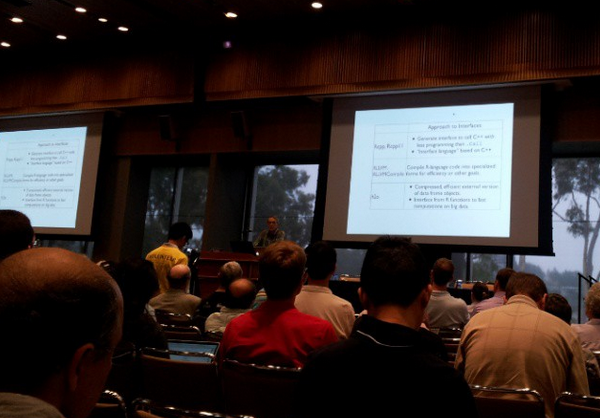
Last week the LA R meetup featured another round of 5 speakers each highlighting a few things they had found interesting at the useR! 2014 conference. This was the second such event after the first one in September - probably because useR! was awesome enough that it inspired 10 volunteers to stand up on stage and talk more about it.
Part 2 of the dplyr tutorial is now available! Hadley will be covering Grouped Mutate/Filter, Joins, Do, and Databases. (You can find Part 1 of the tutorial here.)
For our viewers who have just discovered the wonders of R, keep in mind that this tutorial was filmed in early July of 2014. As R packages naturally update over time (well, depending on the programmers!), please make sure to check Hadley’s Githubfor the latest changes to the dplyr package.
David Diez works on the OpenIntro team, which develops open-source textbooks, statistical software labs, and other course resources for intro-level statistics. This video above is the talk he gave at useR! 2014 entitled “Textbooks fail where Software Succeeds” in which he outlines the challenges unique to open-source textbooks, the state of OpenIntro, and how people can get involved. Below, he discusses these challenges further and offers his thoughts around their solutions.
JJ Allaire has courageously bet, time and time again, on the cutting edge of technologies. In doing so, he has not only benefited from the fertile rains but has often times himself been the rainmaker. He has, to a great degree, democratized development on the web by bringing the power to create interactive web applications to a wider audience than those select few who had access to both a shell account and Unix knowledge. ColdFusion was a platform by the web and for the web, and its adoption revolutionized programming ‘for the web’ as its own worthy pursuit. This story also resolutely validates the idea that by creating tools for developers at the beginning of a time of revolutionary change in technology, one could not only validate the tools but also help stage the unfolding narrative as one with many participants.
Hadley Wickham (perhaps you’ve heard of his work) presented a 2 hour workshop on dplyr at this year’s useR! conference at UCLA. This tutorial was definitely a highlight of the week-long conference for me, and working on this tutorial video has also made me very appreciative of how versatile the dplyr package can be. It clearly is the chef’s knife of data science tools.
Hadley Wickham is hard at work, releasing packages which leverage the expressive power of R to keep easy things intuitive, and to make hard things possible. Having already developed a number of packages which address other steps in the data processing and analysis pipeline, he chose to address the process by which R developers ingest, manipulate, and transform data. This package, dplyr, is a narrowly focused library, designed to provide 90% of the functionality required in most data munging tasks. It may not solve every possible problem in data munging, but dplyr’s built in primitives will reduce your need to drop to “base R” for most common tasks. It does so by leveraging the magritr package’s “pipe” operator, and is inspired by dataflow programming constructs. It is fast, it is powerful, and it has been the single largest productivity boost that many of us here at DataScience.LA have adopted in 2014. In this video, Hadley provides a very quick introduction to the dplyr package, describing his philosophy behind the package’s design while providing a number of illustrative examples as to the flexibility, expressiveness, and power of this tool.
Joe Cheng is a software engineer. Unfortunately the term gets thrown around pretty lightly, so I’d like to make sure that I convey the appropriate amount of gravitas when I refer to him as such. Joe Cheng is a *great* Software Engineer. He has worked for some of the largest technology companies on the planet, building cutting edge tools which empowered the web browser as a full blown platform instead of a historical curiosity. Joe is one of those software engineers who saw a future with the web as a platform for modern software, then worked hard to make it a reality. When the time came to build the next generation of data science IDEs, an IDE targeting the web as a platform, RStudio called Joe.
There comes a time in a software toolchain’s lifecycle where the focus shifts from developer productivity and preference to the ability to deploy solutions in production which coexist gracefully in the enterprise. Configuration management and dependency management are two of the first points of friction in this transition, as the free-wheeling methods preferred by developers are at odds with the structured methods and isolation desired by administrators, who serve as gatekeepers to enterprise deployment. R is currently at this very point in the transition, in the midst of transformation from a language and environment used primarily in academic research to its growing place in the enterprise. At useR! 2014 there were a series of presentations on how dependency management can be addressed within the R ecosystem, ranging from “provider” side options (e.g. freezing CRAN and private repositories) to the client side options, where a project maintains its own dependencies as part of its codebase.
First things first, Dirk Eddelbuettel was recently named ordinary. This seems contradictory, since Dirk is a known HPC expert, an organizer of the R in Finance conference, the creator of Rcpp, and a Debian contributor. These are only a few of the many accolades bestowed upon Dirk without even a hint of puffery. And yet, Dirk Eddelbuettel is considered ordinary. What makes Dirk ordinary? It should be mentioned that to the Vienna-based nonprofit that provides R’s leadership, the R Foundation for Statistical Computing, ‘ordinary’ means something quite different to the lay person. Ordinary members provide guidance and direction for the R Project for Statistical Computing. It’s hard to imagine someone more qualified than Dirk for this task.
At useR! 2014 Ramnath Vaidyanathan gave a tutorial and a presentation on one of his current project, rCharts. This R package allows you to create, customize and share interactive visualizations straight from R. rCharts leverages several existing javascript visualization libraries such as polychart, MorrisJS, NVD3, xCharts, HighCharts, leaflet, and Rickshaw, providing R users a fantastic array of new features and visualization styles.
At the useR! 2014 conference, without a doubt one of the overriding themes was R’s history, legacy, and future as an interface into the “best of the best” algorithms which were available. Romain Francois’ package, Rcpp11, is very much the spirit and the letter of this ethos and telos of R as an interface. This package is a reimplementation of Dirk Eddelbuettel’s Rcpp package with an emphasis on C++ 11’s features. Whether it’s an R user hitting performance limitations, or someone trying to integrate a C/C++ library into their analysis, Romain’s tools are there to help.
Martin Maechler is a member of R-Core. This distinction puts him in the very apex of understanding of the R programming language and environment. He is a professor of statistics with wide and varied interests and a leading expert in statistical computing environments. He is also a prolific programmer, evidenced by his maintenance of the officially recommended cluster package for unsupervised clustering and analytics, the lead developer of Emacs Speaks Statistics, and co-maintainer of the Matrix package… plus too many other contributions to list them all here.
Heather Turner is a biostatistician and Associate Fellow at the University of Warwick, as well as a consultant. She is a former editor of the R Journal, was a local organizer for the useR! 2011 conference, and holds a wealth of information about the field of data science, the state of the technology, and the wider community.
At useR! 2014, one of the most anticipated presentations was Joe Cheng’s Shiny: R made interactive. It was but one of the of a fantastic series of talks by RStudio representatives; check out Winston Chang’s ggvis: Interactive graphics in R for another great talk. Shiny begins with your R code and ends with the customer’s view: an interactive, browser-accessible application. This enables you to place a great deal of power into your users’ hands to customize their view and provides a variety of new and innovative ways to interact with the data, such as by tuning parameters and focusing on sub-populations. Essentially, Shiny functions by allowing you to “wire up” up a reactive application, greatly speeding up the development of a data and analysis based web app.
In science consensus is irrelevant. What is relevant is reproducible results. The greatest scientists in history are great precisely because they broke with the consensus.
– Michael Crichton
Yihui Xie intended to make it easier to do his homework, but instead found himself tackling one of the greatest problems in modern science: the reproducibility of results.
Matt Dowle holds a wealth of knowledge and is worth listening to for a variety of reasons. He has worked for some of the world’s largest financial organizations, holding positions at the focal point between money and data. He has been programming in R for well over a decade. He has lived the open source mantra, by not only consuming open source software but also releasing his own community contributions to CRAN. On top of those accomplishments, he’s also quite funny and spins a heck of a good yarn.
“At one point, the only source for daily R news was David Smith’s blog.” – Szilard Pafka
David Smith is an integral part of the R community. His background in computational statistics goes back to the early 90s . David has worked at Revolution R, one of the leading R companies, for nearly a decade. His name has been included in lists such as:
At useR! 2014, John Chambers was generous enough to provide us with insight into the very early stages of user-centric interactive data exploration. He explains, step by step, how his insight to provide an interface into algorithms, putting the user first has placed us on the fruitful path which analysts, statisticians, and data scientists enjoy to this day. In his talk, John Chambers also does a fantastic job of highlighting a number of active projects, new and vibrant in the R ecosystem, which are helping to continue this legacy of “a software interface into the best algorithms.” The future is bright, and new and dynamic ideas are building off these thoughtful, well measured, solid foundations of the past.
Many of us here in the DataScience.LA Team were also involved in organizing the useR! 2014 conference, the annual get-together of the wonderful R community, which brought over 700 R users and developers from all over the world to Los Angeles this past July.