Eyeo festival highlights
Amelia McNamara
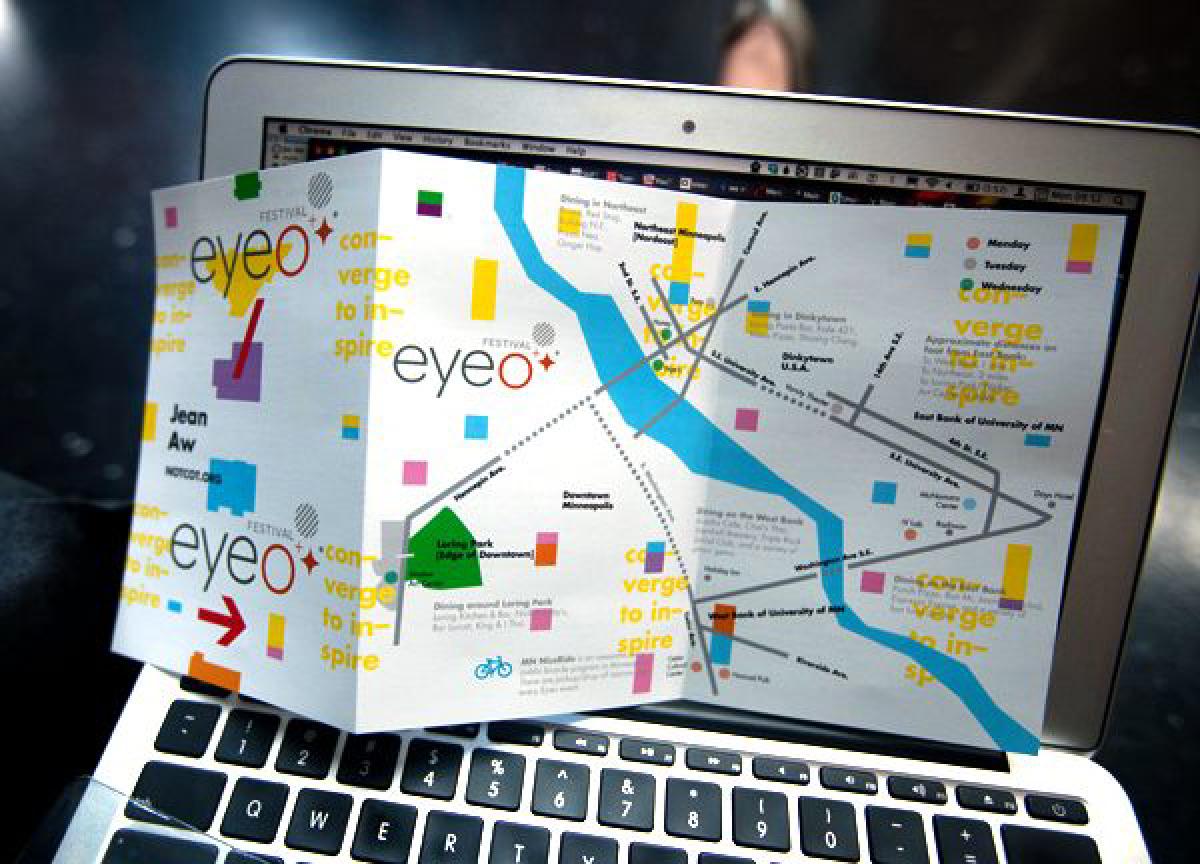
From the festival website, “Eyeo assembles an incredible set of creative coders, data designers and artists, and attendees – expect enthralling talks, unique workshops and interactions with open source instigators and super fascinating practitioners.” I’ll talk about some of the most inspiring talks and projects I saw at Eyeo this year, including work by Santiago Ortiz, Lillian Schwartz, Cod.Act, Kate Crawford and Nicholas Felton. Most of this work can be described best by the term “art,” so come expecting provocations, not prototypes. To learn more about the festival, visit eyeofestival.com
Amelia is a statistics PhD candidate at UCLA. Her research interests include statistics education, statistical computing, and data visualization. She attends events like Eyeo in order to gain inspiration for future work.
Date: August 26, 2014
Timeline:
- 6:00pm networking
- 7:00pm talk start promptly
You must have a confirmed RSVP and arrive between 6:00-6:55pm in order to pass security. Please RSVP here on Eventbrite.
Also, to get updated on subsequent meetups and get other useful community information, please sign up to the DataScience.LA mailing list.
Venue: Cornerstone OnDemand in Santa Monica will kindly host this meetup.