It pains me to admit it, but even though I had visited their site, created an account, and played around with their tools, I didn’t really get the value proposition behind Plot.ly. I already use ggplot, bokeh, and d3.js, I already use knitr and ipython notebooks, so why do I need a new way of posting my plots on a web page?
On my own and before the meetup, it made no sense. Why was this company getting such positive press? How on earth could Plot.ly have attracted a customer list including some of the Who’s Who of scientific and research institutions? After the meetup presentation, which covered topics ranging from rich visualization to collaboration architectures, I spoke to the Plot.ly team, and I brought this up… how I had missed the value proposition completely, how their website did a poor job of explaining why I should care. Their response was great…
“We hear this all the time, and we’ve ended up traveling around telling people what we do instead of clearly showing them on the site. Traveling to everyone’s meetups isn’t very scalable, so we have a website redesign in the works.”
It was a very funny, very human moment which conveyed so much about the truth of running a Data Science / Visualization startup in 2014. Our field is complicated, and sometimes effectively telling a story is hard - even if you’re in the business of helping people tell stories.
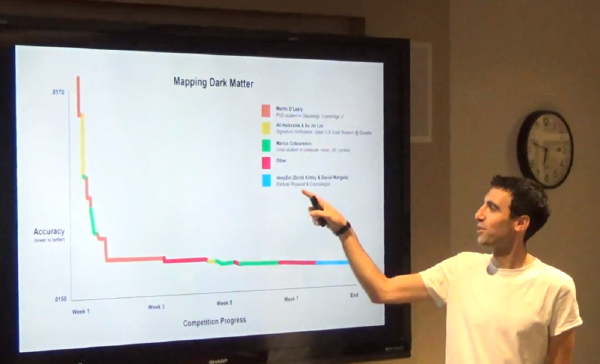
For me, the Plot.ly meetup was one of the most impactful and interesting meetups of 2014 for DataScience.LA, and it’s a shame that so many of our members missed it. Out of nearly 120 RSVPs, only 30 members made it in person (with nearly 10 still on a waiting list). Sure, it was rainy and cold and on the brink of the holiday season, but I guarantee you that every single person that missed it would have considered the trip worthwhile.
Those in attendance had the privilege of speaking one-on-one with a Plot.ly team that is genuinely breaking new ground in the world of inter-language visualization collaboration. I learned that Plot.ly isn’t just about beautiful, interactive, web based graphics. Plot.ly is about collaboration across data science teams using disparate programming languages. I can build a graph in R using ggplot2, push it to Plot.ly, and my collaborator can download it for use in Python using matplotlib. The folks at Plot.ly have built a generalized vocabulary to describe data visualization across these tools, functioning as universal translators between the major programming languages used in Data Science.
Enjoy the video of Plot.ly’s wonderful, educational, and insightful presentation. If you live in the area, make it a New Year’s resolution to make it to one of our DSLA meetups in 2015… and if you RSVP’d and won’t be able to make it, please go ahead and cancel. One day you may be the one on a meetup waiting list eagerly awaiting your opportunity to attend!