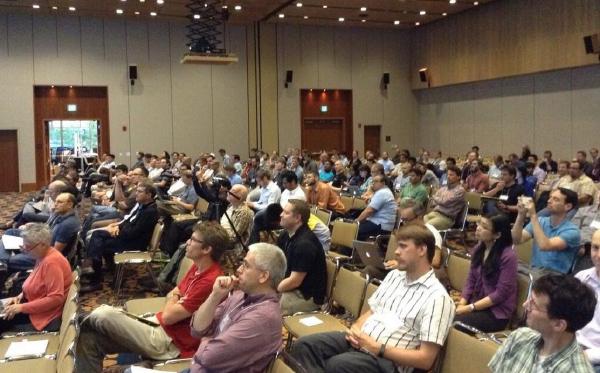
Hadley Wickham (perhaps you’ve heard of his work) presented a 2 hour workshop on dplyr at this year’s useR! conference at UCLA. This tutorial was definitely a highlight of the week-long conference for me, and working on this tutorial video has also made me very appreciative of how versatile the dplyr package can be. It clearly is the chef’s knife of data science tools.
Hadley’s presentation was just under 2 hours long, and the edited footage where we omitted breaks gives us 90 minutes of wisdom and inspiration. I’ve split this tutorial into 2 relatively even parts for your learning convenience. If this is your first-ever attempt at learning dplyr, I definitely suggest concentrating on the basics presented here in Part 1 before moving on to next week’s video. Two great pieces of advice to follow during this tutorial come from some of the R greats:
One of Martin Maechler‘s rules of good R programming practice is to never copy and paste. Try to always type the commands; go line by line through the code and do your best to understand why it is what it is.
In his introduction, Hadley Wickham provides a gem that I want to highlight here.
Whenever you’re learning a new tool, for a long time you’re going to suck… But the good news is that is typical, that’s something that happens to everyone, and it’s only temporary.
Part 1 (this video) covers the following topics:
- A introduction, a bit of theory, and a description of the data
- Single table verbs (filter/select/arrange/mutate/summarise) and grouped summaries
- Data pipelines
I designed this video to be as user-friendly as possible, in hopes of inspiring newcomers to R and rStudio alike. Hadley’s talk was obviously geared towards an intermediate/advanced audience, so I’ve added my own annotations (in light blue) as quick tips for beginners. As you’ll see, Hadley’s workshop often took short breaks for “homework”. I highly urge you pause the video during each problem set and attempt to figure it out on your own before proceeding to the answers. There are also several occasions where Hadley goes off-script from the “dplyr-tutorial.pdf” and tweaks his own solution to the problem sets with answers from the crowd. Don’t worry if the answers on the PDF don’t match the video - remember that there are many different methods of programming in R, and part of the learning process is to find your own style. Most importantly, when you get stuck don’t forget to consult our amazing #rstats community available via Twitter, StackOverflow, Reddit, and other various places across the internet.
Note: I did not have access to Hadley’s console while editing this video, so the console overlays you’ll see are my best attempts to recreate the code he is using. For this reasons, any hypothetical errors are certainly mine and not Hadley’s.
In order to give you time to digest Part 1 before embarking upon Part 2 of this tutorial, we will be publishing Part 2 next week. This video will cover grouped mutate/filter & window functions, joins via two table verbs, and the “Do” function and related databases. Feel free to provide feedback on this tutorial in the comments below, or via my Twitter at @timothy_phan.
Hadley’s scripts from this tutorial can be accessed here. Press “Download as .zip” in the top right corner to download the entire directory. Happy learning, and remember: figuring out how to teach yourself new concepts is essential to improving as a data scientist.
Good luck, and stay tuned for Part 2 next week!