

↓ Skip to main content

John Chambers useR! 2014 Keynote

At useR! 2014, John Chambers was generous enough to provide us with insight into the very early stages of user-centric interactive data exploration. He explains, step by step, how his insight to provide an interface into algorithms, putting the user first has placed us on the fruitful path which analysts, statisticians, and data scientists enjoy to this day. In his talk, John Chambers also does a fantastic job of highlighting a number of active projects, new and vibrant in the R ecosystem, which are helping to continue this legacy of “a software interface into the best algorithms.” The future is bright, and new and dynamic ideas are building off these thoughtful, well measured, solid foundations of the past.

To understand why this past is so important, I’d like to provide a brief view of the historical context that underpins these breakthroughs. In 1976, John Chambers was concerned with making software supported interactive numerical analysis a reality. Let’s talk about what other advances were happening in 1976 in the field of software and computing:

  • In January of 1976, the very first Cray-1 (a commercially available supercomputer), developed by Cray Research, is available.
  • In April of 1976, Steve Jobs and Steve Wozniak decide to form a little company called Apple Computer.
  • In November of 1976, some kid in New Mexico decides to start a company with the audacious goal of making money from selling software, he picks the name MicroSoft.
  • In December of 1976, the very first word processor for personal computers is released, Electric Pencil.

Suffice it to say, 1976 was clearly a very busy year, and at the very earliest dawn of the transition from a priesthood of centralized computing to a democratized land of individualized computing. At the crest of that wave, on May 5th, 1976, John Chambers sketched out an idea in a laboratory at the famed Murray Hill office of Bell Labs.
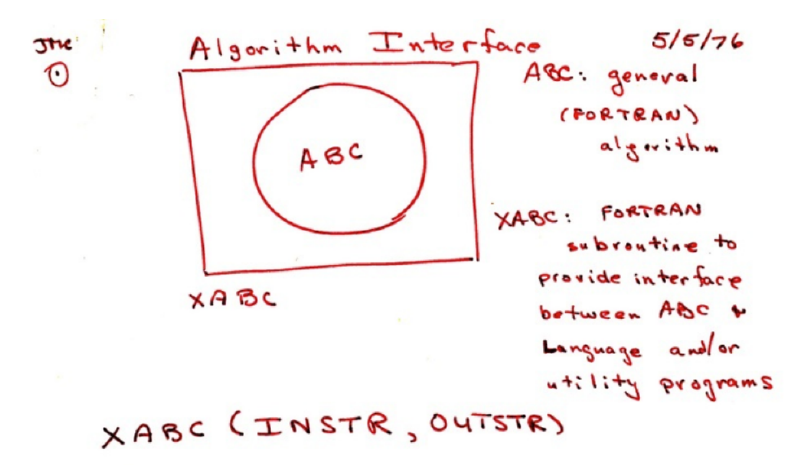
Chambers Sketch

Stated simply, there should be an interface to the very best numerical algorithms available. Those algorithms should be implemented in the way is most natural for them, in whatever language is best for them (usually Fortran), but the user should be freed from the constraints of working at such a low level. The user should be able to think at a higher level, manipulate at a higher level, and be productive at a higher level.

Thus was born the S programming environment, the predecessor to R, and in no small part to almost every user-centric scientific software tool today. For this achievement, John Chambers received the coveted ACM Software System Award in 1998, for the feat of “forever altering the way people analyze, visualize, and manipulate data.”

Related

Hadley Wickham presents dplyr at useR! 2014

Hadley Wickham is hard at work, releasing packages which leverage the expressive power of R to keep easy things intuitive, and to make hard things possible. Having already developed a number of packages which address other steps in the data processing and analysis pipeline, he chose to address the process by which R developers ingest, manipulate, and transform data. This package, dplyr, is a narrowly focused library, designed to provide 90% of the functionality required in most data munging tasks. It may not solve every possible problem in data munging, but dplyr’s built in primitives will reduce your need to drop to “base R” for most common tasks. It does so by leveraging the magritr package’s “pipe” operator, and is inspired by dataflow programming constructs. It is fast, it is powerful, and it has been the single largest productivity boost that many of us here at DataScience.LA have adopted in 2014. In this video, Hadley provides a very quick introduction to the dplyr package, describing his philosophy behind the package’s design while providing a number of illustrative examples as to the flexibility, expressiveness, and power of this tool.

Packrat presentation at useR! 2014

There comes a time in a software toolchain’s lifecycle where the focus shifts from developer productivity and preference to the ability to deploy solutions in production which coexist gracefully in the enterprise. Configuration management and dependency management are two of the first points of friction in this transition, as the free-wheeling methods preferred by developers are at odds with the structured methods and isolation desired by administrators, who serve as gatekeepers to enterprise deployment. R is currently at this very point in the transition, in the midst of transformation from a language and environment used primarily in academic research to its growing place in the enterprise. At useR! 2014 there were a series of presentations on how dependency management can be addressed within the R ecosystem, ranging from “provider” side options (e.g. freezing CRAN and private repositories) to the client side options, where a project maintains its own dependencies as part of its codebase.

Interactive Visualizations from R using rCharts

At useR! 2014 Ramnath Vaidyanathan gave a tutorial and a presentation on one of his current project, rCharts. This R package allows you to create, customize and share interactive visualizations straight from R. rCharts leverages several existing javascript visualization libraries such as polychart, MorrisJS, NVD3, xCharts, HighCharts, leaflet, and Rickshaw, providing R users a fantastic array of new features and visualization styles.