
↓ Skip to main content
Making Maps with a Punchline

Making Maps with a Punchline

I’ve had a lifelong fascination with maps, and working with R definitely enables my map habit. Perhaps there’s something about being an immigrant that made me particularly introspective, since from a very early age I was aware that I was “from” one place on the map and now lived at this “other place.”

Some of my earliest family memories are of my father calling out a random city such as Reykjavik and my sister and I scrambling in response to be the first to find it on one of the many world atlases distributed throughout our house. They’re very fond memories, since playing Find the Wacky-Sounding City is a fantastic way to spend time with your kids.

One of my other favorite things to do is express my love of humor and my love of maps through ggplot. I love building facetious maps to amuse my Twitter followers, and recently discovered a lovely little data set containing states where it is illegal to have fireworks delivered.

So I wrote a little R function for the Fourth of July that put together a joke map and delivers a zinger:

joke_map <- function(states_to_highlight, title="", highlight_colors=c("#aaaaaa", "#ee0000")) {
  library(dplyr)
  library(ggplot2)
  library(RColorBrewer)
  library(maps)

  highlighting = data.frame(region=tolower(state.name[match(states_to_highlight, state.abb)]),
                             highlight=TRUE)

  d = map_data("state") %>% left_join(highlighting, by="region")
  d[is.na(d$highlight),]$highlight <- FALSE

  p <- ggplot(d) + geom_polygon(aes(x=long, y=lat,
                                   group = group, fill=highlight),
                               colour="black") +
    scale_fill_manual(values=highlight_colors) +
    ggtitle(title) +
    xlab("") +
    ylab("") +
    theme(axis.ticks = element_blank(), axis.text.x = element_blank(), axis.text.y = element_blank()) +
    guides(fill=FALSE)

  p
}

Source: gist ab49e04 by earino

Not exactly groundbreaking R code, I know, but quite handy. I was able to simply call the function with dataset I had found at fireworks.us and have a little chuckle.
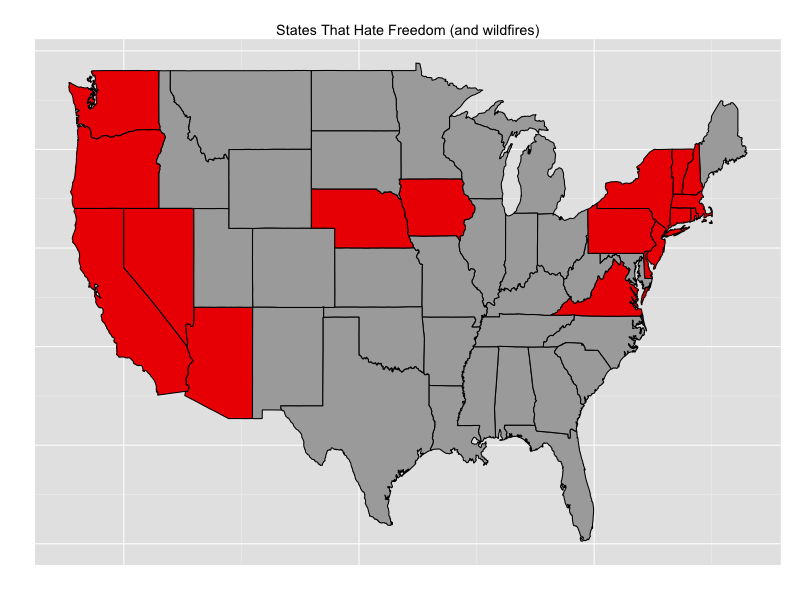
Rplot

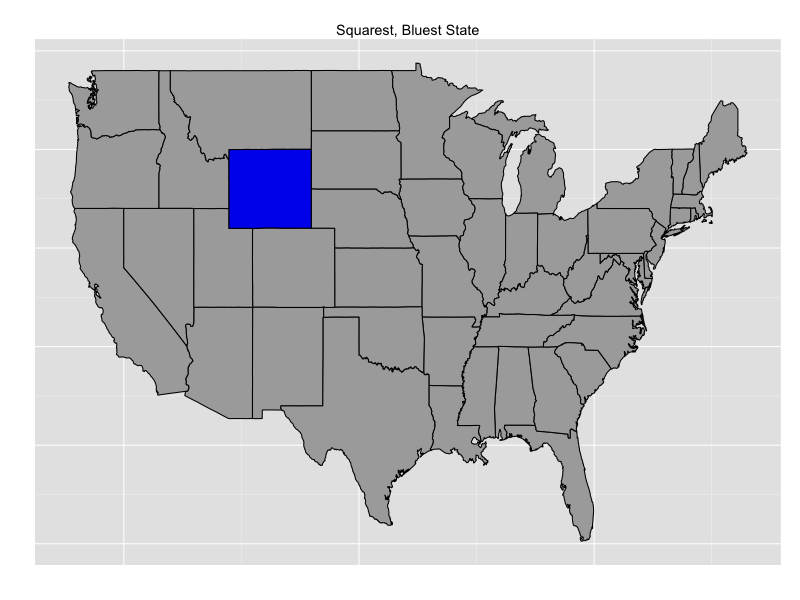
Enjoy the code, and have fun generating imaginary internet points! As I get older, I’ve also been working on my Dad joke superpowers, so I’ll leave you with my latest masterpiece:

map <- joke_map(states_to_highlight = c("WY"), title = "Squarest, Bluest State", highlight_colors=c("#aaaaaa", "#0000ee"))

Source: gist 65623ce by earino

Rplot02

Related

Re: Sorry for the mix up regarding Data Science candidates

·4 mins
This was originally posted on the author’s LinkedIn You will find lots of advice on how to get a job as a data scientist. I want to add some signal to the noise. I happen to be hiring for a Data Scientist or two as of this writing, and was thinking of doing a blog post on offering advice for those looking. But then I thought of something better and more insightful: It is a cut-and-paste of an email that I sent to our Director of Talent Acquisition last week when he asked me, “Can you share with me what you’re looking for in regards to your Data Scientist candidates?”

The Importance of 'Janitorial Work' in Research

As someone who has spent a significant amount of time ‘data wrangling’ outside the field of data science, I found this recent New York Times article both highly interesting and nothing new - I’ve seen the same issue discussed in a variety of fields with similar automation solutions presented each time. Granted, there are fields where this janitorial drudgery is absolutely necessary, such as molecular biology. As a scientist working on researching mRNA expression you certainly have to keep RNase-free conditions, meaning you have to ‘clean up’ your bench in a more detailed way than you’d ever imagine before you can run your first PCR cycle. This includes specific protocols for washing your dishes several times with special water before you even start because if you don’t, you’re not likely to get any bands in your electrophoresis gel and you’ll lose several days (or weeks!) of work.

4 archived comments

Comments are closed. These were posted on the original site.

Matt

I love maps too! Do you do all your mapping in R? I've used R to mine data, but then I usually map projects in qGIS.

Eduardo

I don't usually do mapping very professionally, it really is something I do for fun or as part of a knitR workflow. However, now that I've started to look at qGIS, I can see that this addiction could get a lot deeper :)

Kevin Wright

Wyoming should be red. Because of the Republican party. That would be funnier.

Eduardo

lol! i know. i didn't want to be political and instead went for a more absurd joke. You are, of course, more than welcome to repost a better version of this joke wherever you wish :)