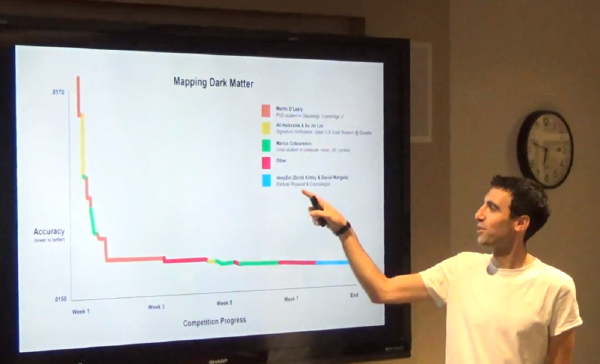

Plotly is a web-based platform for making graphs and analyzing data. Plotly’s APIs and web app let teams work together online to make 2D, 3D, and streaming graphs using R, Python, MATLAB, Julia, SAS, and and Excel, all together, all in one platform. The goal is to support technical and non-technical collaboration at all levels. Plotly translates ggplot2, matplotlib, and MATLAB plots into interactive, web-based, shareable plots.
Speaker’s bio**:**Jack Parmer (CEO of Plotly) studied physics and organic electronics at Stanford University, then worked at various bay area cleantech start-ups before starting Plotly. He’s interested in Plotly’s ability to help data-driven teams solve complex problems with more collaborative workflows. He lives in Oakland, California.
Date**:**December 16, 2014
Timeline**:**
- 6:00pm food/bev & networking
- 7:00pm talk start promptly
You must have a confirmed RSVP and arrive between 6:00-6:55pm in order to pass security. Please RSVP here on Eventbrite.