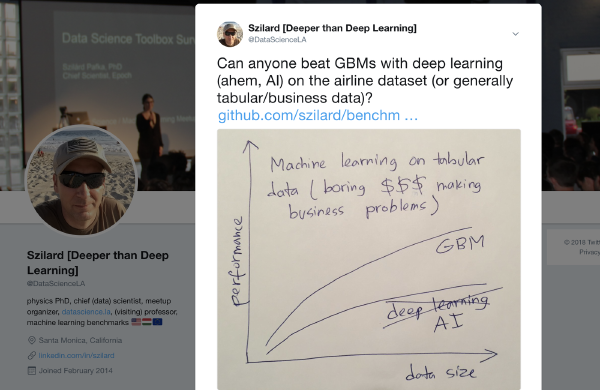
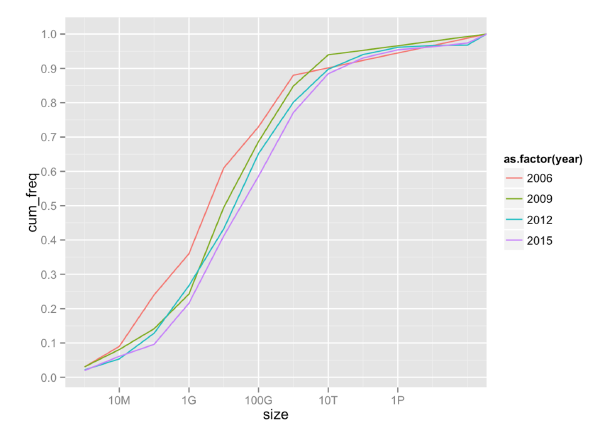
With so much hype about “big data” and the industry pushing for “big data” analytical tools for everyone, the question arises how many people have big data (for analytics) and how many of them really need these tools (which are more complex and often more immature compared to the traditional tools for analytics).
If you’ve never heard of kaggle, I guess the first question I have to ask is “how did you end up on DataScience.LA?” :)
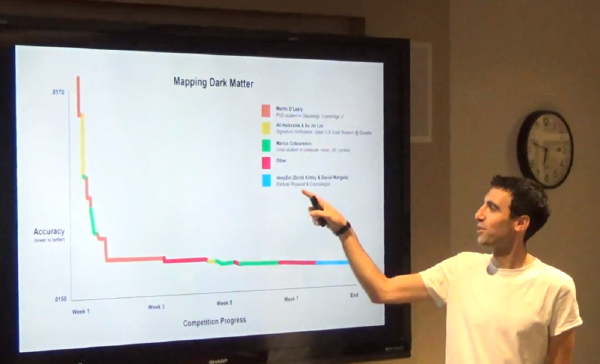
Kaggle is one of the foremost machine learning competition websites on the internet. Companies from GE to Criteo and everything in between create competitions. These competitions are in the form of a dataset, ranging from small to relatively large (up to many many gigabytes), a stated goal (such as predicting an event or finding a numeric value) and an evaluation criteria. The Kaggle community has grown in the last few years, so that now competitions often host thousands of participants!
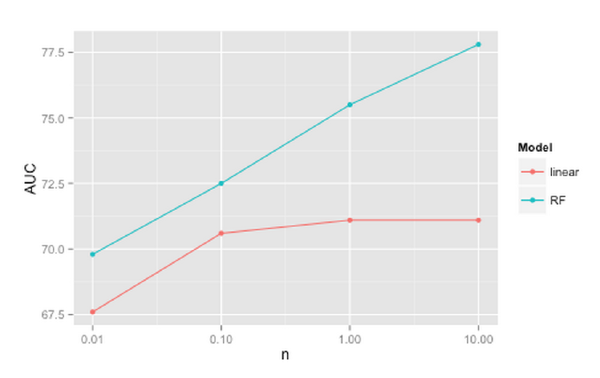
I currently have the need for machine learning tools that can deal with observations of the order of 10 millions in the context of binary classification. That kind of data is a few GBs in size and it fits comfortably nowadays in the RAM of a decent single machine. It is a trivial task for linear models, as there are plenty of open source tools that can train a logistic regression with this amount of data on a single machine in a few seconds, even while using only 1 processor core (many of these tools are single-threaded). Linear models are also the gold standard of large-scale machine learning that can run on clusters, processing very large distributed datasets.
(Posting the slides and video recording from this event is long overdue - our apologies for the delay.)
At the September LA Data Science/Machine Learning meetup we had IRIS.TV’s Chief Data Scientist Tom Sullivan and VP of Engineering Joel Spitalnik presenting.
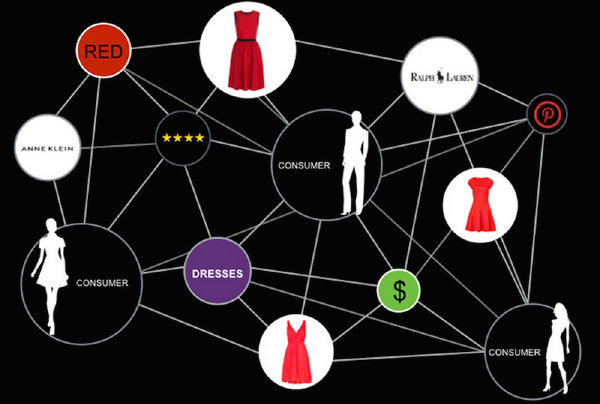
IRIS.TV is a video recommendation engine, and in their excellent talk Tom & Joel shared with us their approach to personalization and how they use machine learning to achieve their goals. They also shared the architecture of their systems, including how data is flowing between the various parts (i.e. the ETL pipeline). One thing that popped up as a question and I found interesting is that the usage of R and Python in their company is split 50-50. In fact, while Tom is using mainly R, Joel is using mainly Python. While this is perhaps unusual at a relatively small startup, our survey on software tools used for data science revealed that most data scientists in LA (at least those attending the meetups) are using R or Python, with a roughly equal split/small advantage for R. It just happens that for obvious reasons (such as network effects) that one tool dominates in most companies.