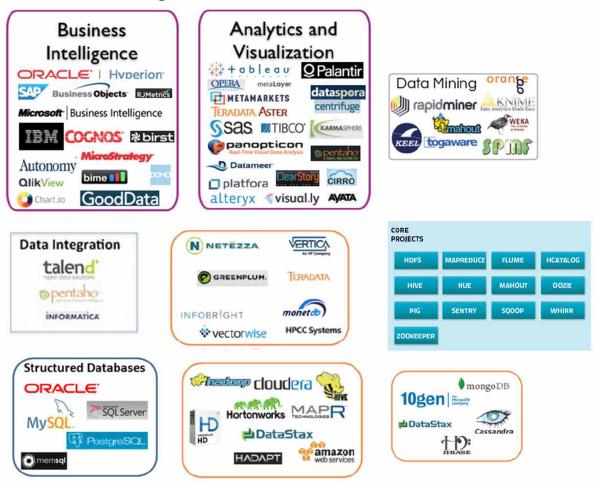
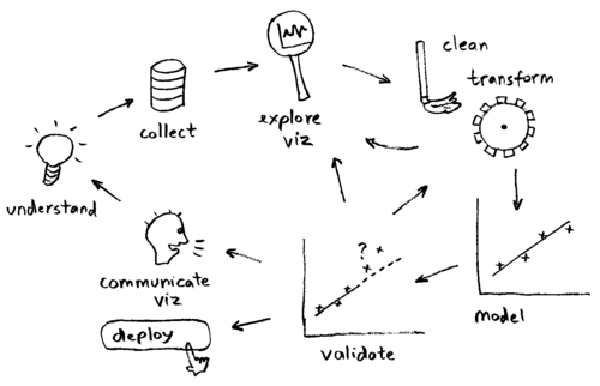
The LA Data Warehouse, Business Analytics and Analytics meetup had a fantastic first event with a great audience (full house), an awesome host (thanks Edmunds: Punnoose for taking the lead and the Team onsite and helping) and a great mix of 3 talks overviewing the field.
I’m pleased to announce the first event of our new Python Data Science LA meetup, started by two of us here at DataScience.LA (our very own Szilard and Eduardo).
We’ll have 5 speakers at this event, covering various aspects of the Python Data Science ecosystem (NumPy, SciPy, pandas, matplotlib, scikit-learn, NetworkX, NLTK, IPython notebook, etc.)
This is a re-publication of a blog post from a blog I created not long before we got the idea to start DataScience.LA, and in many aspects it is the genesis of DSLA (the blog’s name, the people getting together - thanks Eduardo, Amelia and Leigh). It was also the spark that lead to the creation of the Python Data Science LA meetup.
At useR! 2014 Ramnath Vaidyanathan gave a tutorial and a presentation on one of his current project, rCharts. This R package allows you to create, customize and share interactive visualizations straight from R. rCharts leverages several existing javascript visualization libraries such as polychart, MorrisJS, NVD3, xCharts, HighCharts, leaflet, and Rickshaw, providing R users a fantastic array of new features and visualization styles.
At useR! 2014, one of the most anticipated presentations was Joe Cheng’s Shiny: R made interactive. It was but one of the of a fantastic series of talks by RStudio representatives; check out Winston Chang’s ggvis: Interactive graphics in R for another great talk. Shiny begins with your R code and ends with the customer’s view: an interactive, browser-accessible application. This enables you to place a great deal of power into your users’ hands to customize their view and provides a variety of new and innovative ways to interact with the data, such as by tuning parameters and focusing on sub-populations. Essentially, Shiny functions by allowing you to “wire up” up a reactive application, greatly speeding up the development of a data and analysis based web app.